This article will discuss how to monitor SQL performance real-time. Two methods will be covered: the Windows Performance Monitor built-in tool and the open-source PerfMon program. We will also share some tips for monitoring SQL performance.
SQL performance monitoring is an essential part of any database-driven app. Inconsistent data, slow performance and even data loss can all be caused by poorly performing SQL queries.
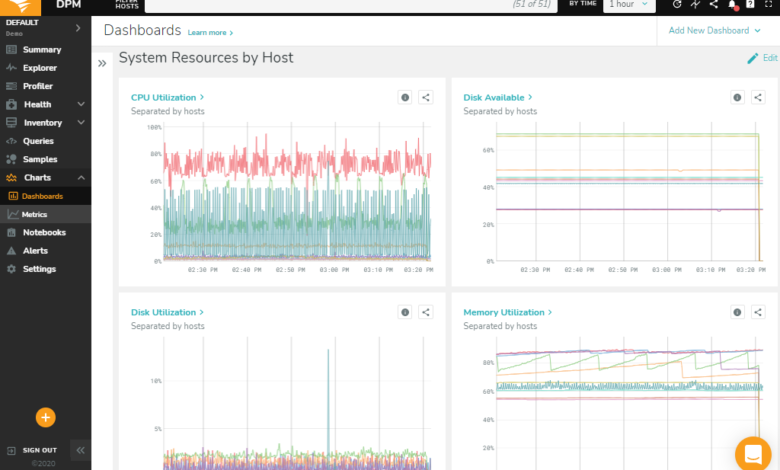
Although there are many tools that can monitor SQL performance, most of them require extensive configuration before they can give useful information. Many tools provide only information about past performance and can be difficult to fix or identify current problems.
This article will introduce you to PerfMon+, a tool that allows you to track SQL performance in real time.
PerfMon+, a free and open source tool, allows you to view all SQL queries currently running on your database server. It provides information on query execution times and memory usage.
Installation PerfMon+:
PerfMon+ can be downloaded for Windows, Linux and macOS. The latest version can be downloaded from the PerfMon+ site.
After you have downloaded the correct version for your operating systems, you can run the installer and follow the on-screen instructions to install it.
Configuring PerfMon+
Once PerfMon+ has been installed, you need to configure it so that it can connect to your database server(s). You can either use the PerfMon+ interface to do this or edit the configuration file.
Select the “Add Server” option in the File menu to connect to a PerfMon+ database server. This will open the dialog box “Add Server”.
You will need to enter hostname, IP address, and credentials for access to the database server in the “Add Server” dialog box.
After you’ve entered all the information, click “OK” to save your changes.
Now you should see your database server listed under the PerfMon+ interface. Click on the link to expand and view all options.
Monitoring SQL Queries
Select the “SQL” option from the available monitors to begin monitoring SQL queries. This will open the “SQL Monitor” interface.
The “SQL Monitor” interface will display a list all SQL queries currently running on your database server. You will find information about each query such as the execution time and memory usage.
To sort the queries by a column, you can click on it. This is useful if you need to quickly identify the most memory-intensive or longest-running queries.
FAQs:
Q – What is PerfMon+?
A: PerfMon+, a free and open-source tool, allows you to view all SQL queries currently running on your database server(s). It provides information on query execution times and memory usage.
Q. How can I install PerfMon+
A: The latest PerfMon+ version can be downloaded from the PerfMon+ site. After you have downloaded the correct version for your operating systems, you can then install it by running this installer and following the instructions.
Q: How do I configure PerfMon+?
A: PerfMon+ must be configured to connect to your database server(s) after it has been installed. You can either use the PerfMon+ interface to do this or edit the configuration file.
Q: How do I use PerfMon+?
A: Select the “SQL” option from the available monitors to begin monitoring SQL queries. This will open the “SQL Monitor” interface. The “SQL Monitor” interface will display a list all SQL queries currently running on your database server. You will find information about each query such as the execution time and memory usage.
Q. What are the benefits of PerfMon+?
A: PerfMon+ allows you to track SQL performance in real time. It provides information on query execution times and memory usage.
Conclusion:
PerfMon+ can be used to monitor SQL performance in real time. It’s easy to set up and configure. You can also get detailed information about memory usage and query execution times.